
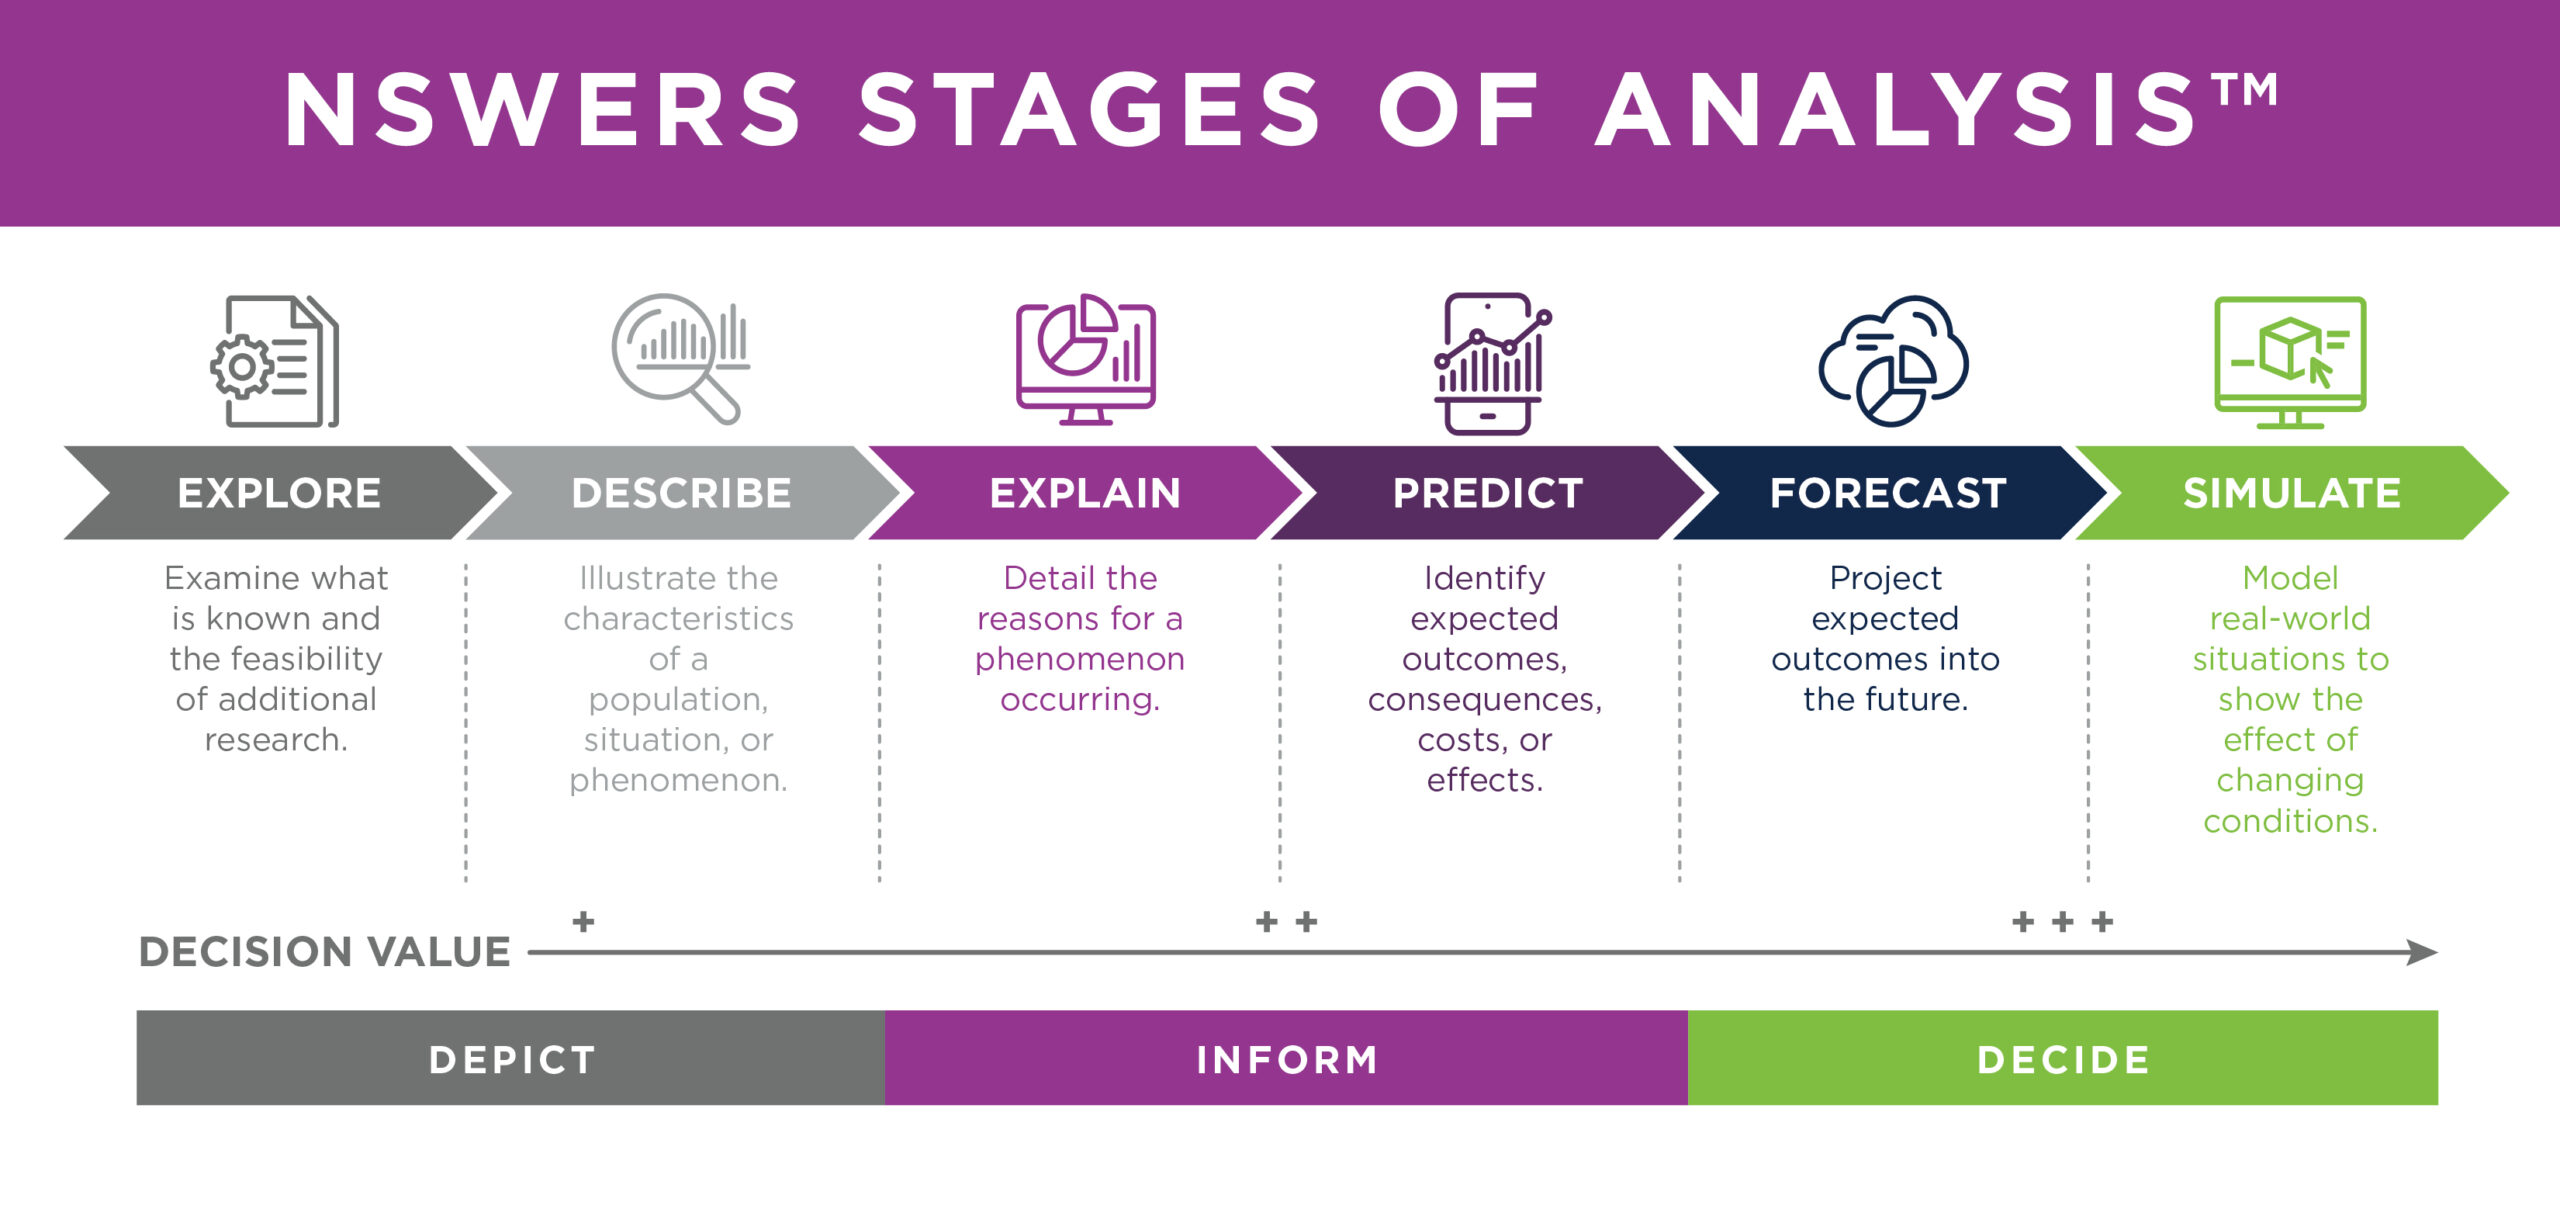
NSWERS created a six-stage research framework used to analyze the Eight NSWERS Outcomes. This framework – known as the NSWERS Stages of Analysis™ – is strategically designed to embody a modern, flexible, scalable approach to analytic activity. What’s more, it seeks to focus our work towards those research questions, methods and approaches that best support decision making. With each subsequent stage (e.g. moving from Explore to Describe or from Explain to Predict), research activity is characterized by:
- Increased complexity in the types of questions being asked
- Increased sophistication in analytic approach and research methodologies
- Increased value provided to decision makers
At the baseline level, explore-type questions describe the current state of research, both at an internal level and in academic literature more broadly. On the other side of the continuum, simulate-type questions provide a mechanism for understanding how education and workforce outcomes might change when inputs and processes in systems are modified. Each of the stages are presented more fully below, organized alongside a brief overview of the stage, including an illustrative (but not comprehensive) list of research questions, and methodological approaches appropriate for the analyses of each stage.
Questions in the explore stage provide an overview and background of the current state of knowledge surrounding the factors that contribute to the education and workforce environment in Nebraska. These might include literature reviews, data dictionaries, feasibility reports, and auxiliary data that are relevant within and across educational settings. For example, one may be concerned with the so-called “skills gap” or “employment gap” in the state. The explore stage helps end-users of the NSWERS system, loosely defined to be those with decision making authority in the education space, to get on the same page with how outcomes, such as “employment gap” are defined, how they are measured, and what does the relevant literature say about how the outcome has been modified or improved in other locations, such as in pilot programs or through larger system-wide changes.
Research Question Types
- What is already known about the NSWERS outcome?
- How is it best measured?
- Is the data already collected and accessible?
- If applicable, what proxy variables might be utilized or estimated?
Included Research Constructs/Variables
Initially, any of the eight NSWERS outcomes will be a focus for the research products from this stage.
Example Questions
- How is Postsecondary Persistence typically defined when used as an outcome in academic research or in a state or federal program evaluation context?
- How is Employment Gap measured? What are each of the data sources that contribute to its measurement and are they readily available to NSWERS for analysis?
- What pilot programs for manipulating Industry Placement of students (e.g. increasing the number of those in technology industries) have been attempted in other states?
- Are there any common themes that differentiate successful programs from unsuccessful ones?
- Did these programs have any successful manipulations, such as incentive programs or implementing unique training experiences?
Methodological Approaches
Analyses in the explore stage will qualitatively review and summarize academic literature, white papers and documentation from external student longitudinal data systems, best practices documents, and may conduct and review stakeholder interviews to ensure a thorough understand of the outcomes and relevant variables.
Analyses in the describe stage are concerned with single variable descriptive statistics and visualizations. These will be produced for the eight NSWERS outcomes but also for highly relevant and informative research constructs that provide an understanding of the historical and current state of the Nebraska’s education system. For instance, an analysis in the describe stage may provide the percentage of students graduating high school on-time or a frequency distribution of high school students identifying in each of the commonly reported racial categories. Describe stage analyses will not typically provide information on conditional distributions (i.e., graduation rates conditional on gender or other variables), but do require grouping data on a set of pre-determined commonly defined cohorts like the Nebraska Department of Education’s expected cohort graduation year and first-time, full-time undergraduate students.
Research Question Types
What are the summary characteristics of the NSWERS outcome?
How does the outcome change with respect to time or geographic regions within the state?
Included Research Constructs/Variables
The primary variables used in this stage are the eight education and workforce outcomes, but any generally informative input, process, or output variable may be visualized or analyzed.
Example Questions
What is the College Going rate for students from a specific Nebraska high school cohort?
What percentage of college students are still enrolled in college one year after beginning (Postsecondary Persistence) among the entering cohort of first-time, full-time students of a given year?
Methodological Approaches
Analyses in the describe stage will conduct traditional univariate statistics for describing the distribution of an outcome. Many analyses will result in data visualizations that allow for understanding the magnitude of quantities that represent data categories. Statistics are also descriptive in nature, intending to calculate estimates of lower order distributional moments. The specific techniques that will be used are listed below. Note that approaches in the describe stage do not generally require statistical hypothesis testing.
Statistical Techniques
- Measures of central tendencies (mean, median, and mode)
- Measures of spread (variance, standard deviation, interquartile range, various quantiles)
- Measures of distribution (density estimation, KL divergence, Kolmogorov–Smirnov test)
- Spatially Varying Coefficient Models
Data Visualizations
- Bar chart
- Donut chart
- Line chart
- Map
- Alluvial diagram
The explain stage provides analyses that answer bivariate research questions, such as those that provide estimates for value, rate, percentage, or frequency conditional on the value of a second variable. Analytic methods in this section will primarily be linear in nature, such as estimating cell/group means, regression coefficients, or correlations. Where appropriate, control variables may be included in a statistical model to demonstrate specific effects.
Analyses conducted in this stage will include traditionally applied research methodologies within education such as linear regression, mixed effects models, ANOVA, or other techniques. Visualizations may show trendlines grouped by relevant cross-sections of the data overlaid on a bivariate scatterplot, etc. Analyses in this stage provide benefit by aiding in the determination of research constructs and variables that are known to have either correlational or causal effects for the outcomes.
Research Question Types
How is the NSWERS outcome influenced by or related to other factors?
How does that influence differ when accounting for additional variables?
What are the predictor variables the have the largest overall impact on the outcome?
Included Research Constructs/Variables
The previously listed outcome variables serve as the predicted variable (e.g. the “y” variable in a multiple regression model). Any other appropriate research constructs will serve as predictor variables in the models, with variable selection being theory driven and informed by results of analyses from the explore stage.
Example Questions
What is the effect of Academic Success measures on On-Time High School Graduation?
What is the effect of Degree Subject Area on Time to Employment when controlling for Gender, Race, and Ethnicity?
How does Dual Credit impact College Going when controlling for Academic Readiness
Do differences in Academic Load and Area of Study predict differences in Academic Performance? Does this have downstream effects on Postsecondary Graduation?
What is the effect of K12 Academic Engagement on Postsecondary Persistence?
Methodological Approaches
In the explain stage, we fit a series of statistical models to aid in understanding the effects of various inputs, processes, and outputs on the eight NSWERS Outcomes. These models are not necessarily focused on prediction, but instead simply getting a sense of “what works” and “what doesn’t.” Of note in this stage is the calculation of standardized effect size measures, which do not apply to the univariate analyses of the previous stages and is more difficult for the (non-linear) prediction focused statistical models that are to be fit in the analyses occurring at later stages of analysis.
Statistical Techniques
Linear regression
Mixed effects models
ANOVA
Structural equation modeling (mediation and moderation)
- Random Forests
Data Visualizations
Sparkline
Bar chart
Line chart
The eponymous predict stage aims to identify expected outcomes, consequences, costs, or effects through fitting modern exploratory prediction models. Analyses in this stage look for key drivers that impact the NSWERS outcomes, taking special consideration for understanding the influence constructs/variables has on the outcome and control that decision makers have over those factors. Results from these analyses can be used to provide decision makers with information on thresholds at which input variables make the largest difference in the NSWERS outcomes.
Research Question Types
What is the probability of the NSWERS outcome occurring?
What is the most/least likely outcome?
How does this probability differ when accounting for additional variables?
What are variables that both have large effects on the outcome and have may be able to be improved by intervention programs?
What are key thresholds for the predictor past which students are more likely to attain the outcome?
Included Research Constructs/Variables
In the predict stage, we still focus on the eight NSWERS outcomes, but using the research constructs as predictor and clustering variables.
Example Questions
What are the patterns of high school and college Coursetaking Behavior that align most closely with 150 percent-time Postsecondary Graduation?
What are relevant thresholds in High School Progression and K12 Academic Success that predict College Going?
What clusters of interactions between K12 Staff Demographics and K12 Student Demographics are meaningful in predicting On-Time High School Graduation?
What are the clusters of K12 variables (e.g. At-risk Status, School Transfer Patterns, School Enrollment Size, Academic Readiness, First Generation Student, or Demographic Variables) that suggest a student may require additional support to meet Postsecondary Persistence expectations?
How does Postsecondary Persistence, Academic Load, and Degree Subject Area influence Time to Employment?
How do wages earned during postsecondary education affect Employment Location?”
Methodological Approaches
Analyses in the predict stage move beyond traditional/simple linear statistical models and into families of models that favor minimized out of sample prediction error over model interpretability. The models will typically require fine-tuning for use in the specific context but provide meta-parameters that aid in this fine-tuning. Use of these models will necessarily include basis expansion (i.e. non-linear transforms of the predictor variables) and regularization (i.e. model constraints to prevent over-fitting and improve generalization).
Statistical Techniques
Tree-Based machine learning algorithms (e.g. CART, Random Forest)
Clustering (e.g. SVM, KNN, K-means)
Change point analysis
Generalized Additive Models (GAMs)
The purpose of the forecast stage is to provide projections for necessary constructs into the future. These analyses may focus on the NSWERS outcomes or specific subsets of outcomes (e.g. how many students will graduate with at least two courses of postsecondary training in programming/ software development over the next 3-5 years). Alternatively, analyses from this stage may provide forecasts for potential inputs or outputs of any of the education and workforce development systems.
Research Question Types
What is the probability of the NSWERS outcome projected over the next 3-5 years?
Included Research Constructs/Variables
The primary research questions will focus on the eight key outcomes, but feasibly any questions regarding the change in inputs and outputs of the education system over time may be answered by this section.
Example Questions
- How many postsecondary graduates will enter the workforce in Nebraska (Employment Location) over the next 5 years?
- What is the expected breakdown of Degree Subject Area for these graduates?
- Does the probability of working in Nebraska depend on Postsecondary Academic Success?
- How many public K12 students will meet the minimum admission requirements (based on K12 Coursetaking Behavior and Academic Readiness) for a given postsecondary institution over the next 5 years?
- What percentage of a specific cohort will obtain a Postsecondary Degree/Award or Industry Credential 6 years after graduating from high school?
- How does K12 Coursetaking Behavior predict Industry Placement over the 3 – 5 years after educational exit?
- How does the projected changes in K12 population size impact the projected counts of college going students?
Methodological Approaches
The methodological approaches used in the forecast stage depend heavily on the nature of the data. A subset of the analytic techniques listed below are only appropriate for forecasts with a large number of data points, and certain models may have high prediction error in the presence of a random shock (e.g. such as a global pandemic).
Statistical Techniques
Time series graphics
Linear models
Longitudinal mixed effects models (with time varying covariates) • ARIMA models
Exponential smoothing
Model Averaged Forecasts
The purpose of analyses in the simulate state is to model and predict how perturbations to the education and/or workforce development systems might impact the NSWERS outcomes variables down the line. For example, one may consider how increasing participation in a particular K12 program affects college going rates among that population. Knowing this, one may simulate increasing participation in that program and determine thresholds of diminishing returns for the purpose of setting targets. Naturally, decision makers will have to consider the costs and benefits of achieving those targets.
Research Question Types
How do simulated changes affect the probability of the NSWERS outcome
What set of conditions optimize the probability of the NSWERS outcome?
Included Research Constructs/Variables
The NSWERS outcomes will be the object of each simulation model. That is, analyses in this stage will aid in understanding how changing education and workforce inputs and processes affect the NSWERS outcomes.
Example Questions
What is the effect of modifying K12 FTE Staff on student On-Time High School Graduation?
How does increasing the proportion of students that have taken at least one course in computer programming/computer technology (K12 Course Taking Behavior) affect the number of Nebraska K12 students that go on to major in that Degree Subject Area at a postsecondary institution?
How does increasing the proportion of out of state students (State of High School Graduation) affect the proportion of graduates who are working in Nebraska (Employment Location) 5 years after Postsecondary Graduation?
How does changing Course Offerings over time affect Coursetaking Behavior in those Course Subject Areas over time?
How does K12 Gifted and Talented status impact in-state College Going?
How does in-state College Going affect Employment Location specifically for this K12 subgroup?
How does K12 Career Education Program Participation affect Employment Location?
Does student participation in these programs increase the probability of working in Nebraska (Employment Location) after educational exit?
What percentage of participation optimizes Industry Placement and Employment Location?
What would the effect increasing participation in dual enrollment by 10 percent be on the College Going Rate?
Methodological Approaches
Analyses in the simulation stage require providing estimates given changes to education or workforce development inputs. Certain families of prediction/ regression models may not be appropriate for these types of analysis, especially where dependence of the predictor variables is large. For example, one may estimate the effect of increasing a variable, but the difficulty of the act of manipulating that variable depends on patterns of other covariates in the model. NSWERS expects that sophistication of analyses in the simulation stage to evolve over time, but a list of useful statistical models is provided below. Generally, an initial approach will be to fit candidate models and generate samples from (conditional) posterior distributions and calculate summary statistics to serve as the estimate of the effect of input factor perturbation.
Statistical Techniques
Bayesian network models
Bayesian Copula model
Graphical models
MCMC simulations
Approximate Posterior Sampling
In addition to providing research and data products related to NSWERS core outcomes, a series of standalone research questions that are of broad interest will be produced when they are relevant to multiple NSWERS outcomes, have cross-system impact, or are generally in line with NSWERS mission, vision, and legislative direction:
Mission
Integrate and organize Nebraska’s education and workforce data to inform decision making.
Vision
Create a data-informed decision culture that supports successful pathways of learning and earning for the people of Nebraska.
From Legislative Bill 1160 (section 2, subsection 3):
The Nebraska Statewide Workforce and Education[al] Reporting System is
envisioned as a comprehensive, sustainable, and robust lifelong learning and workforce longitudinal data system to allow for the targeting of resources, and focus data analysis on assessing workforce development and employment success in order to enable the training of tomorrow’s workforce.
Example of research topics that are in line with these aims are provided below:
Cross Outcome:
- K12 Student Attendance
- Academic Growth Trajectories
- Pre/Post Pandemic Comparisons
Cross-System:
- Cradle to Career Pipeline
- Student Flow (Student transfer)
- Dual Enrollment
- College Preparatory Coursework Completion
- First-Year Credit Accumulation/Early Momentum
Workforce Development/Employment Success:
- Career Progression
- Tenure
- Under Employment
- Earned Wages
- Career Transition After High School
- Credential of Value/Minimum Economic Return
- Economic Mobility/Wage Trajectories
Example Questions
- What percentage of high school students transferred schools or districts (Student Transfer) at any time after entering the 9th grade?
- What is the total number of students majoring in computer science/
engineering/technology (Academic Area) among a specific cohort of
college students? - What percent of college students in a given cohort take three or more
courses in mathematics (Coursetaking Behavior) in pursuit of their
degree? - What percent of high school students in a cohort participated in a
career and technical education program related to Health Sciences
(Program Content Domain)?